Showing posts with label research methodology. Show all posts

Wednesday, April 1, 2020

SmartPLS - Measure Reliability


Have you ever heard about PLS? If "YES", it means that you are already in Chapter 4 (Data Analysing). It just few more steps before you can complete your thesis. So, how can we measure PLS model? The answer is, we need to first measure whether our model is reliable or not. Reliability can be measured by assessing the composite reliability and the Cronbach's Alpha of the model whereas validity can be measured through convergent and discriminant validity.

First of all, we need download the SmartPLS software from HERE and install it into our computer and click 'Run'. The software will be automatically installed.

In this post, I'll show you step-by-step how to calculate reliability through SmartPLS. Fyi, I use SmartPLS version 2 since it FREE. Hehehe.

Step 1: Click the draw button and design the IVs and DV


Step 2: Click "Calculate" --> PLS Algorithm


Step 3: Calculate the PLS. Click "Finish"


Step 4: Remove the loading items less than 0.6. According to Hair et al., (2011), the loading should be more than 0.6


Step 5: The remaining items should be greater than 0.6


Step 6: The items with value greater than 0.6 remain in the model and ready to be calculated


Step 7: Retrieve the composite reliability (CR), Cronbach's alpha and Average Variance Extracted (AVE) by clicking "Report" --> Html (Print) Report


Step 8: The report will be exported to HTML and we can still access the data offline. How great isn't it? No need to worry even if we have an unstable Internet connection (^_^)


Step 9: The first criterion to be evaluated is typically internal consistency reliability. The traditional criterion for internal consistency is Cronbach's alpha. In PLS we are using internal consistency reliability to represent the Cronbach's alpha.


Step 10: Copy the table


Step 11: The table can be "paste" [ctrl+v] in the Microsoft Excel. Then, highlight the value of Cronbach's Alpha and click "decrease decimal" to reduce the decimal point. So, it can increase the readability. 


Step 12: The value of Cronbach's Alpha now can be easily read


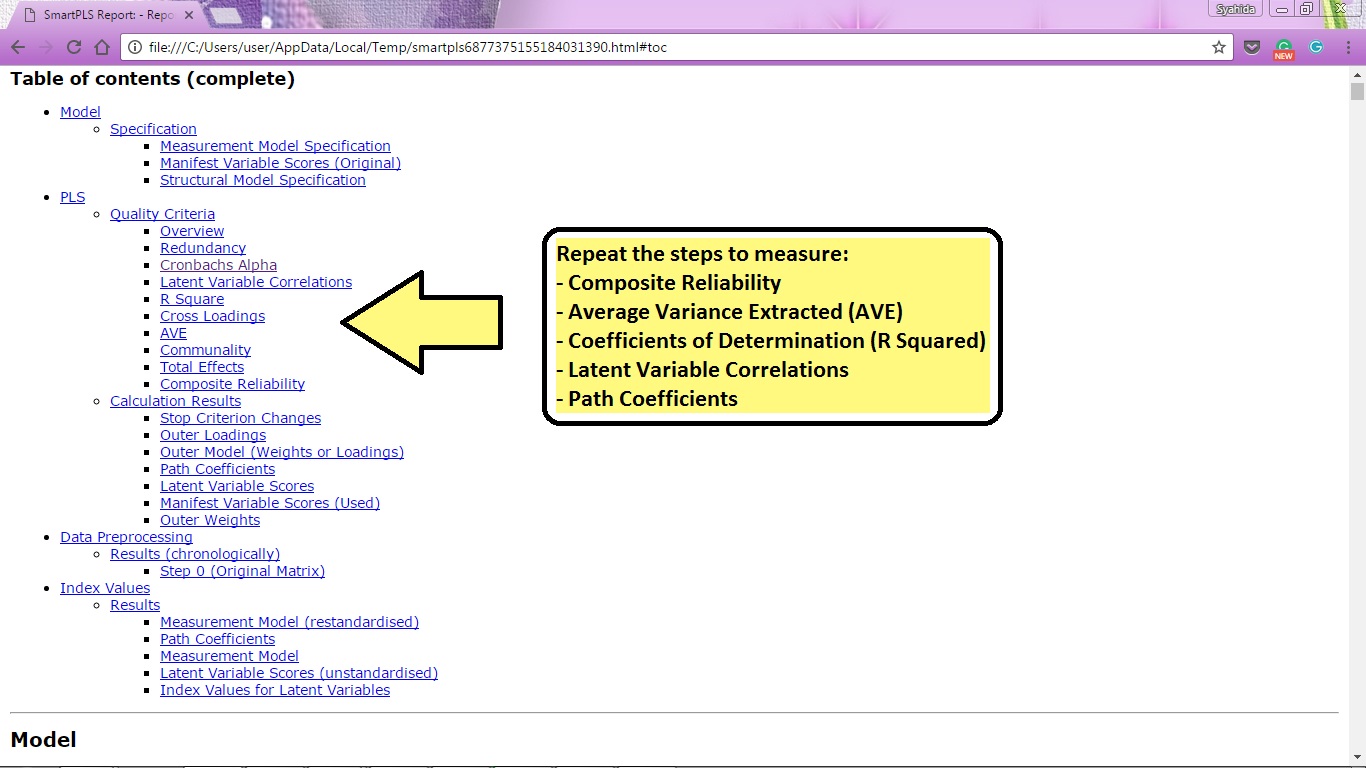
Step 13: Repeat Step 9 to Step 12 to calculate the value of Composite Reliability, AVE, Coefficients of Determination (R2), Latent Variable (LV) correlations and Path Coefficients.

Step 14: Copy the overview of result and "paste" in Microsoft Excel

Step 15: This is how the result looks like in Microsoft Excel before we reducing the decimal points and re-design the table below before we can include it in our report.


From the result, it shows that all reflectively measured constructs have AVE values of 0.605 and higher, which is considerably above the critical value of 0.5. The AVE value of at least 0.5 indicates sufficient convergent validity, meaning that a latent variable is able to explain more than half of the variance of its indicators on average. In addition, all composite reliability values are well above the critical threshold of 0.7.

These are the steps in measuring reliability through SmartPLS. But, how can we explain those numbers? What are the meaning of those numbers? To guide you in analysing those numbers, you can refer these papers HERE and HERE. These papers also explain further on structural model evaluation and hypothesis testing.

That's all for now. 

Till next time and take care! (^_^)

Friday, December 20, 2019

What is Unidimensionality?

Unidimensionality is always been described as a specific type of measurement scales. It has only one (uni) dimension. Unidimensionality refers to the existence of a single trait or construct underlying a set of measures (Gerbing & Anderson, 1988).

The confirmatory factor analysis (CFA) assess the internal and external consistency of unidimensionality implied by a multi indicator measurement model that cannot be assessed by Cronbach Alpha and item to total correlation. The additional unidimensionality test were added to suit SEM analysis.


Unidimensionality can be achieved if the factor loadings of the measuring items for the respective latent construct are acceptable. Factor loading which is too low should be deleted for the model to be unidimensionality.


(ref: From an article with interaction effect, HERE)

Monday, September 2, 2019

Why Use PLS

Source: From Google

There are several reasons why postgraduate students prefer to use PLS in measuring their model. Hair et al., (2013) listed several reasons for using PLS to measure model:
  • PLS can be used for theory confirmation or theory development.
  • PLS makes fewer demands regarding sample size (e.g. <20).
  • PLS better than CBSEM when data were normally distributed, with a small sample size and correlated exogenous variables.
  • PLS does not require normal-distributed data. [CBSEM use the usual maximum likelihood estimation method, which assume multivariate normality]
  • PLS can be applied to more complex structural equation model.
  • PLS able to handle both reflective and formative construct.
  • PLS is better suited for theory development than for theory testing.
  • PLS is especially useful for prediction (prediction intention). Prediction is more important than parameter estimation.
  • PLS has ability to handle multicollinearity among IVs and small samples.

Tips for VIVA: Examiners might ask you, why you choose this PLS rather than SEM, SPSS or other statistical tools? Sometimes, they might ask why you use PLS 2 but not PLS 3? So, try find the answer for these questions before attending your VIVA session. 

I wish you all the best in your VIVA! You can do it!

Reference:
Hair, Jr. J. F., G. Tomas Hult, C. Ringle, and M. Sarstedt. “A primer on partial least squares structural equation modeling (PLS-SEM)”. Thousand Oaks, Sage, 2013.

Tuesday, September 25, 2018

Basic Concept of PLS


What is PLS? 

PLS is an acronym for Partial Least Squares. There are actually many alternatives for students to measure the reliability and validity of a model. For example, they can use either IBM software for SPSS, SmartPLS software for PLS, SEM, AMOS or other statistical software. However, during my study, I have employed PLS to measure the research model.

The process of analysing the data can be done by using the statistical software SmartPLS (Smart PLS 2.0) for Windows or PLS. In an investigation, a structural equation modelling approach using PLS technique is employed to evaluate the proposed hypotheses through the research model.

SmartPLS performs a Confirmatory Factor Analysis (CFA) while evaluating the partial least squares (PLS). The examination on CFA is done to confirm the subscales to be in the right group. The application of CFA is particularly appropriate in an investigation if there is an argument about the dimensionality or factor structure of a scale or measure (Kelloway, 1998). Hence, conducting CFA in an investigation would assist the researcher to address the issues arising in the construct validity that is related to the measurement of scale. The investigation conducts a Cronbach alpha test to solve the issues related to the scale measurement reliability. As for the last analysis, Partial Least Square Path Modeling is measured with an attempt to examine the bond between latent variables.

According to Hair et al. (2014), PLS-SEM is a prediction-oriented, variance-based approach to SEM that is based on limited predictions about the distribution of the variables. PLS-SEM denoted as PLS path modelling (PLS-PM) is primarily used to extend theories in exploratory researches by focusing on explaining the variance in the dependent variables as the researchers measured the model (Hair et al., 2013). PLS is justified to have assumptions on non-normal data, small sample sizes and formatively measured constructs (Hair et al., 2014).

Hair et al. (2013) insisted that PLS-SEM can extensively estimate the path relationships in the model using the available data as it minimizes the error terms, which is the residual variance of the endogenous constructs. The researchers further listed the data and model characteristics of PLS-SEM which included: (i) Sample size is small and or the data are non-normally distributed; (ii) Achieve a high level of statistical power with small sample sizes; (iii) Larger sample sizes increase the precision of PLS-SEM estimations; (iv) No distributional assumptions; (v) Handle extremely non-normal data; (vi) Handle construct measured with single and multi-item measures; (vii) Handle both formative and reflective measurement models equally well; (viii) Handle complex models with many structural model relations; (ix) Larger numbers of indicators are helpful in reducing the PLS-SEM bias.

Moreover, researchers also benefit from high efficiency in parameter estimation when applying PLS-SEM instead of CB-SEM (i.e. Covariance-based SEM). To sum up, the several reasons why we use PLS to calculate the measurement model are:
  • PLS can be used for theory confirmation or theory development
  • PLS makes fewer demands regarding sample size (e.g. <20)
  • PLS better than CBSEM when data were normally distributed, with a small sample size and correlated exogenous variables
  • PLS does not require normal-distributed data (CBSEM use the usual maximum likelihood estimation method, which assumes multivariate normality)
  • PLS can be applied to more complex structural equation model
  • PLS able to handle both reflective and formative construct
  • PLS is better suited for theory development than for theory testing
  • PLS is especially useful for prediction (prediction intention - prediction is more important than parameter estimation)
  • PLS has the ability to handle multicollinearity among IVs and small samples

The calculation of reliability and validity using PLS method use can be further viewed in these articles published. The influence of a moderator on the relationship also been measured in these articles:


That's all for now. 
I will update on how to measure PLS model in the next post. 


Wassalam.


Love
Dr SAA