Showing posts with label Fornell-Larcker. Show all posts

Sunday, June 28, 2020

SmartPLS - Measure Validity

We need to evaluate the measurement model before we can know how reliable and valid the model is. As I explained in the earlier post HERE, reliability can be measured by assessing the composite reliability and Cronbach's Alpha whereas validity can be measured through convergent and discriminant validity.

Have you download SmartPLS software? If "YES", you can just proceed to test the validity. If "NO", you can download the software and install it into your computer. In this post, I'll show you step by step on how to calculate validity. 

First, we need to examine the cross-loadings since they are the dominant approaches to measure discriminant validity.

Step 1: Asses indicator loadings by clicking "Default Result" --> "PLS" --> "Calculation Results" --> "Outer Loadings"


The table below shows a complete table of the outer loadings
From the table, we can see that all reflective indicators have loadings of 0.636 and higher. SmartPLS provide outer loadings and outer weights for all construct in the PLS path model, regardless of whether they are measured reflectively or formatively.

Step 2: Assess the Fornell-Larcker criterion, click "Report" --> "PLS" --> "Quality Criteria" --> "Latent Variable Criterion


This is the last step in analysing the cross-loadings. For reflective measurement model, we use Fornell-Larcker criterion. Fornell-Larcker criterion is the second and more conservative approach in assessing discriminant validity. It compares the square root of the AVE values with the latent variable correlations. The square root of each construct's AVE should be greater than its highest correlation with any other construct. The logic of this method is based on the idea that a construct shares more variance with its associated indicators than with any other construct.

The table below shows the Fornell-Larcker criterion before we calculate the square root of AVE

From the table above, we include the values of the square root of AVE


Finally, the table of Fornell-Larcker criterion is complete

These are the needed step in measuring the validity through SmartPLS. So, how can we explain those number? What are those number supposed to mean? Actually, you can refer these papers, HERE and HERE to understand how to analyse our collected data.

Till next time. Be safe and take care! 

Let's fight Covid-19 together!

Wednesday, April 1, 2020

SmartPLS - Measure Reliability


Have you ever heard about PLS? If "YES", it means that you are already in Chapter 4 (Data Analysing). It just few more steps before you can complete your thesis. So, how can we measure PLS model? The answer is, we need to first measure whether our model is reliable or not. Reliability can be measured by assessing the composite reliability and the Cronbach's Alpha of the model whereas validity can be measured through convergent and discriminant validity.

First of all, we need download the SmartPLS software from HERE and install it into our computer and click 'Run'. The software will be automatically installed.

In this post, I'll show you step-by-step how to calculate reliability through SmartPLS. Fyi, I use SmartPLS version 2 since it FREE. Hehehe.

Step 1: Click the draw button and design the IVs and DV


Step 2: Click "Calculate" --> PLS Algorithm


Step 3: Calculate the PLS. Click "Finish"


Step 4: Remove the loading items less than 0.6. According to Hair et al., (2011), the loading should be more than 0.6


Step 5: The remaining items should be greater than 0.6


Step 6: The items with value greater than 0.6 remain in the model and ready to be calculated


Step 7: Retrieve the composite reliability (CR), Cronbach's alpha and Average Variance Extracted (AVE) by clicking "Report" --> Html (Print) Report


Step 8: The report will be exported to HTML and we can still access the data offline. How great isn't it? No need to worry even if we have an unstable Internet connection (^_^)


Step 9: The first criterion to be evaluated is typically internal consistency reliability. The traditional criterion for internal consistency is Cronbach's alpha. In PLS we are using internal consistency reliability to represent the Cronbach's alpha.


Step 10: Copy the table


Step 11: The table can be "paste" [ctrl+v] in the Microsoft Excel. Then, highlight the value of Cronbach's Alpha and click "decrease decimal" to reduce the decimal point. So, it can increase the readability. 


Step 12: The value of Cronbach's Alpha now can be easily read


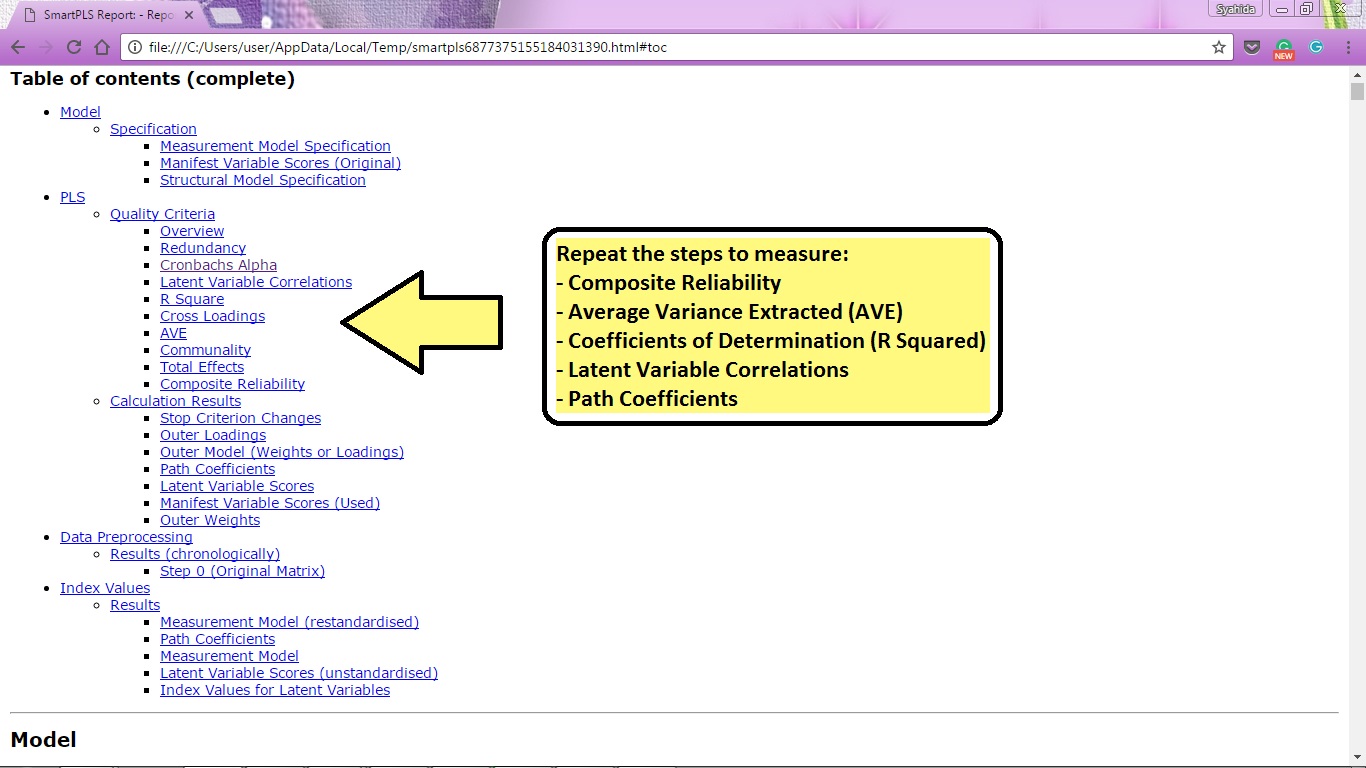
Step 13: Repeat Step 9 to Step 12 to calculate the value of Composite Reliability, AVE, Coefficients of Determination (R2), Latent Variable (LV) correlations and Path Coefficients.


Step 14: Copy the overview of result and "paste" in Microsoft Excel

Step 15: This is how the result looks like in Microsoft Excel before we reducing the decimal points and re-design the table below before we can include it in our report.


From the result, it shows that all reflectively measured constructs have AVE values of 0.605 and higher, which is considerably above the critical value of 0.5. The AVE value of at least 0.5 indicates sufficient convergent validity, meaning that a latent variable is able to explain more than half of the variance of its indicators on average. In addition, all composite reliability values are well above the critical threshold of 0.7.

These are the steps in measuring reliability through SmartPLS. But, how can we explain those numbers? What are the meaning of those numbers? To guide you in analysing those numbers, you can refer these papers HERE and HERE. These papers also explain further on structural model evaluation and hypothesis testing.

That's all for now. 

Till next time and take care! (^_^)