Showing posts with label PLS. Show all posts

Sunday, June 28, 2020

SmartPLS - Measure Validity

We need to evaluate the measurement model before we can know how reliable and valid the model is. As I explained in the earlier post HERE, reliability can be measured by assessing the composite reliability and Cronbach's Alpha whereas validity can be measured through convergent and discriminant validity.

Have you download SmartPLS software? If "YES", you can just proceed to test the validity. If "NO", you can download the software and install it into your computer. In this post, I'll show you step by step on how to calculate validity. 

First, we need to examine the cross-loadings since they are the dominant approaches to measure discriminant validity.

Step 1: Asses indicator loadings by clicking "Default Result" --> "PLS" --> "Calculation Results" --> "Outer Loadings"


The table below shows a complete table of the outer loadings
From the table, we can see that all reflective indicators have loadings of 0.636 and higher. SmartPLS provide outer loadings and outer weights for all construct in the PLS path model, regardless of whether they are measured reflectively or formatively.

Step 2: Assess the Fornell-Larcker criterion, click "Report" --> "PLS" --> "Quality Criteria" --> "Latent Variable Criterion


This is the last step in analysing the cross-loadings. For reflective measurement model, we use Fornell-Larcker criterion. Fornell-Larcker criterion is the second and more conservative approach in assessing discriminant validity. It compares the square root of the AVE values with the latent variable correlations. The square root of each construct's AVE should be greater than its highest correlation with any other construct. The logic of this method is based on the idea that a construct shares more variance with its associated indicators than with any other construct.

The table below shows the Fornell-Larcker criterion before we calculate the square root of AVE

From the table above, we include the values of the square root of AVE


Finally, the table of Fornell-Larcker criterion is complete

These are the needed step in measuring the validity through SmartPLS. So, how can we explain those number? What are those number supposed to mean? Actually, you can refer these papers, HERE and HERE to understand how to analyse our collected data.

Till next time. Be safe and take care! 

Let's fight Covid-19 together!

Wednesday, April 1, 2020

SmartPLS - Measure Reliability


Have you ever heard about PLS? If "YES", it means that you are already in Chapter 4 (Data Analysing). It just few more steps before you can complete your thesis. So, how can we measure PLS model? The answer is, we need to first measure whether our model is reliable or not. Reliability can be measured by assessing the composite reliability and the Cronbach's Alpha of the model whereas validity can be measured through convergent and discriminant validity.

First of all, we need download the SmartPLS software from HERE and install it into our computer and click 'Run'. The software will be automatically installed.

In this post, I'll show you step-by-step how to calculate reliability through SmartPLS. Fyi, I use SmartPLS version 2 since it FREE. Hehehe.

Step 1: Click the draw button and design the IVs and DV


Step 2: Click "Calculate" --> PLS Algorithm


Step 3: Calculate the PLS. Click "Finish"


Step 4: Remove the loading items less than 0.6. According to Hair et al., (2011), the loading should be more than 0.6


Step 5: The remaining items should be greater than 0.6


Step 6: The items with value greater than 0.6 remain in the model and ready to be calculated


Step 7: Retrieve the composite reliability (CR), Cronbach's alpha and Average Variance Extracted (AVE) by clicking "Report" --> Html (Print) Report


Step 8: The report will be exported to HTML and we can still access the data offline. How great isn't it? No need to worry even if we have an unstable Internet connection (^_^)


Step 9: The first criterion to be evaluated is typically internal consistency reliability. The traditional criterion for internal consistency is Cronbach's alpha. In PLS we are using internal consistency reliability to represent the Cronbach's alpha.


Step 10: Copy the table


Step 11: The table can be "paste" [ctrl+v] in the Microsoft Excel. Then, highlight the value of Cronbach's Alpha and click "decrease decimal" to reduce the decimal point. So, it can increase the readability. 


Step 12: The value of Cronbach's Alpha now can be easily read


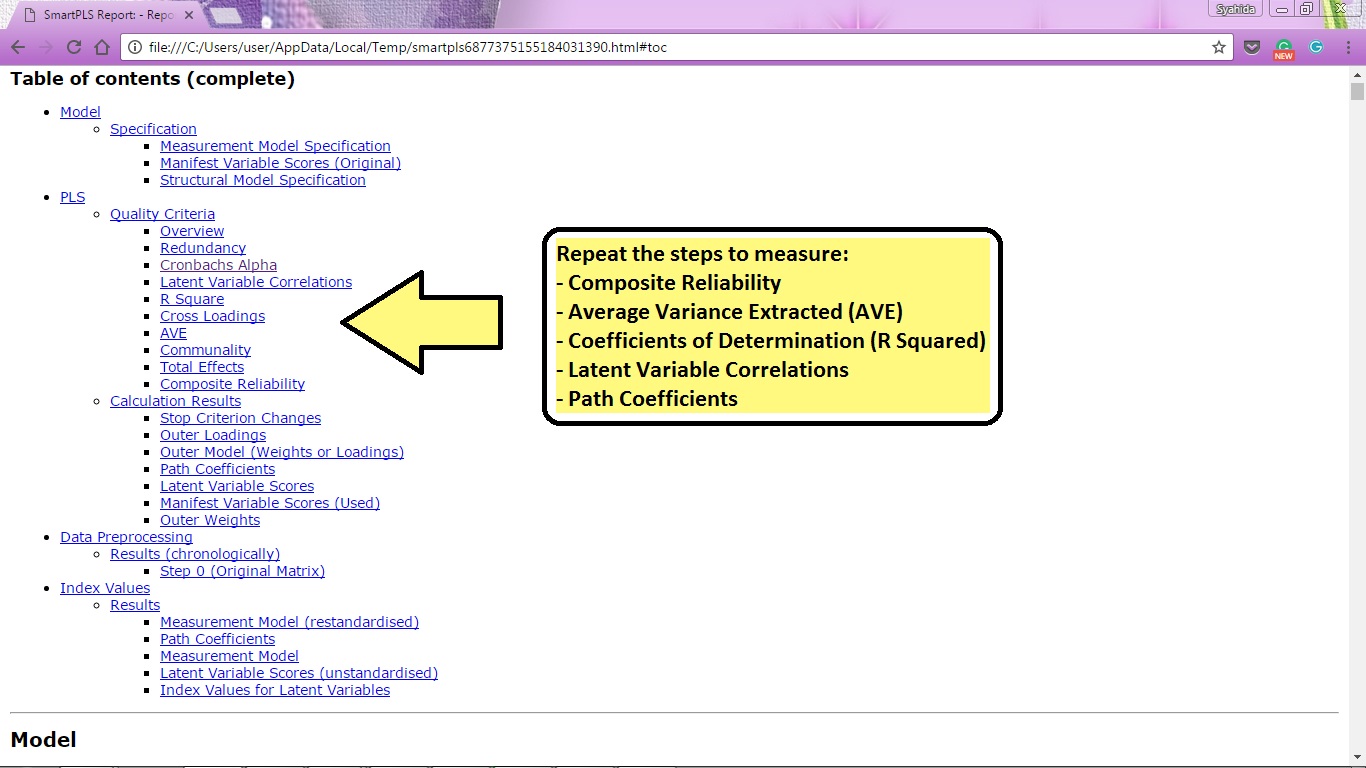
Step 13: Repeat Step 9 to Step 12 to calculate the value of Composite Reliability, AVE, Coefficients of Determination (R2), Latent Variable (LV) correlations and Path Coefficients.


Step 14: Copy the overview of result and "paste" in Microsoft Excel

Step 15: This is how the result looks like in Microsoft Excel before we reducing the decimal points and re-design the table below before we can include it in our report.


From the result, it shows that all reflectively measured constructs have AVE values of 0.605 and higher, which is considerably above the critical value of 0.5. The AVE value of at least 0.5 indicates sufficient convergent validity, meaning that a latent variable is able to explain more than half of the variance of its indicators on average. In addition, all composite reliability values are well above the critical threshold of 0.7.

These are the steps in measuring reliability through SmartPLS. But, how can we explain those numbers? What are the meaning of those numbers? To guide you in analysing those numbers, you can refer these papers HERE and HERE. These papers also explain further on structural model evaluation and hypothesis testing.

That's all for now. 

Till next time and take care! (^_^)

Saturday, February 29, 2020

Reliability and Validity Analysis

Previous scholars have shown that Partial Least Squares (PLS) is a robust technique that has been frequently used in the literature. In PLS, to analyse a model, we need to follow the two-step procedure which are the measurement model and structural model (Hair et al. 1998).

1. Measurement Model
In this step, we measure convergent validity and discriminant validity. 

What are the purpose of measuring convergent validity? The reason for analysing convergent validity is to measure the close relations exist among the items of the same construct. We need to measure composite reliability (CR) and average variance extracted (AVE).


In PLS, the factor loading should be greater than 0.7 (Hair, 2013). We need to remove items loading with less than 0.7 to increase CR or AVE in the first order of the component of independent variables (IVs).

Fornell and Larcker (1981) stated that the CR values should be more than 0.7 and AVE should be greater than 0.5 in order for the result to be accepted. Convergent validity is established if all the values of CR are greater than 0.7 and all the values AVE in a study are greater than 0.5. To know more about how to calculate CR and AVE, you can click HERE (Scopus-indexed journal).


Discriminant validity explains the degree of irrelevance between constructs. To measure discriminant validity, there are two steps which are confirmatory factor analysis and AVE analysis. All items should have high loading on their corresponding constructs. Then, we calculate the square root of the AVE that exceed the inter-correlation of the construct in the proposed model. In order to support discriminant validity, each construct's AVE square root should be greater than its correlations with other constructs. 

To see more about the explanation in analysing convergent and discriminant validity you can either click HERE or HERE
. 


2. Structural Model
Structural equation modelling tested the hypothesised paths of the structural model. All coefficient estimates were significant (p<0.05) in accordance with the hypothesised directions. In testing the proposed hypotheses, the standardised path coefficient is expected to be at least 0.2 and preferably greater than 0.3 (Chin and Newsted, 1999).

The reliability of the coefficients in the study is obtained through a bootstrapping procedure (500 resamples). All t values need to be higher than the theoretical t value of 2.57 for a 5% probability of error. Meanwhile, the p values of 0.000 indicate that all path relationship are significant at a 5% probability of error.


Predictive accuracy of a model can be measured by analysing the coefficient of determination. A rule thumb on the acceptable coefficient of determination is 0.75, 0.50 and 0.25, explaining substantial, moderate or weak level of predictive accuracy, respectively (Hair et al., 2014).

For further explanation on how to calculate the structural equation model analysis and how to explain the predictive accuracy of the model, you can click HERE (Scopus-indexed journal).


Love,
Dr SAA
2

Monday, September 2, 2019

Why Use PLS

Source: From Google

There are several reasons why postgraduate students prefer to use PLS in measuring their model. Hair et al., (2013) listed several reasons for using PLS to measure model:
  • PLS can be used for theory confirmation or theory development.
  • PLS makes fewer demands regarding sample size (e.g. <20).
  • PLS better than CBSEM when data were normally distributed, with a small sample size and correlated exogenous variables.
  • PLS does not require normal-distributed data. [CBSEM use the usual maximum likelihood estimation method, which assume multivariate normality]
  • PLS can be applied to more complex structural equation model.
  • PLS able to handle both reflective and formative construct.
  • PLS is better suited for theory development than for theory testing.
  • PLS is especially useful for prediction (prediction intention). Prediction is more important than parameter estimation.
  • PLS has ability to handle multicollinearity among IVs and small samples.

Tips for VIVA: Examiners might ask you, why you choose this PLS rather than SEM, SPSS or other statistical tools? Sometimes, they might ask why you use PLS 2 but not PLS 3? So, try find the answer for these questions before attending your VIVA session. 

I wish you all the best in your VIVA! You can do it!

Reference:
Hair, Jr. J. F., G. Tomas Hult, C. Ringle, and M. Sarstedt. “A primer on partial least squares structural equation modeling (PLS-SEM)”. Thousand Oaks, Sage, 2013.

Tuesday, September 25, 2018

Basic Concept of PLS


What is PLS? 

PLS is an acronym for Partial Least Squares. There are actually many alternatives for students to measure the reliability and validity of a model. For example, they can use either IBM software for SPSS, SmartPLS software for PLS, SEM, AMOS or other statistical software. However, during my study, I have employed PLS to measure the research model.

The process of analysing the data can be done by using the statistical software SmartPLS (Smart PLS 2.0) for Windows or PLS. In an investigation, a structural equation modelling approach using PLS technique is employed to evaluate the proposed hypotheses through the research model.

SmartPLS performs a Confirmatory Factor Analysis (CFA) while evaluating the partial least squares (PLS). The examination on CFA is done to confirm the subscales to be in the right group. The application of CFA is particularly appropriate in an investigation if there is an argument about the dimensionality or factor structure of a scale or measure (Kelloway, 1998). Hence, conducting CFA in an investigation would assist the researcher to address the issues arising in the construct validity that is related to the measurement of scale. The investigation conducts a Cronbach alpha test to solve the issues related to the scale measurement reliability. As for the last analysis, Partial Least Square Path Modeling is measured with an attempt to examine the bond between latent variables.

According to Hair et al. (2014), PLS-SEM is a prediction-oriented, variance-based approach to SEM that is based on limited predictions about the distribution of the variables. PLS-SEM denoted as PLS path modelling (PLS-PM) is primarily used to extend theories in exploratory researches by focusing on explaining the variance in the dependent variables as the researchers measured the model (Hair et al., 2013). PLS is justified to have assumptions on non-normal data, small sample sizes and formatively measured constructs (Hair et al., 2014).

Hair et al. (2013) insisted that PLS-SEM can extensively estimate the path relationships in the model using the available data as it minimizes the error terms, which is the residual variance of the endogenous constructs. The researchers further listed the data and model characteristics of PLS-SEM which included: (i) Sample size is small and or the data are non-normally distributed; (ii) Achieve a high level of statistical power with small sample sizes; (iii) Larger sample sizes increase the precision of PLS-SEM estimations; (iv) No distributional assumptions; (v) Handle extremely non-normal data; (vi) Handle construct measured with single and multi-item measures; (vii) Handle both formative and reflective measurement models equally well; (viii) Handle complex models with many structural model relations; (ix) Larger numbers of indicators are helpful in reducing the PLS-SEM bias.

Moreover, researchers also benefit from high efficiency in parameter estimation when applying PLS-SEM instead of CB-SEM (i.e. Covariance-based SEM). To sum up, the several reasons why we use PLS to calculate the measurement model are:
  • PLS can be used for theory confirmation or theory development
  • PLS makes fewer demands regarding sample size (e.g. <20)
  • PLS better than CBSEM when data were normally distributed, with a small sample size and correlated exogenous variables
  • PLS does not require normal-distributed data (CBSEM use the usual maximum likelihood estimation method, which assumes multivariate normality)
  • PLS can be applied to more complex structural equation model
  • PLS able to handle both reflective and formative construct
  • PLS is better suited for theory development than for theory testing
  • PLS is especially useful for prediction (prediction intention - prediction is more important than parameter estimation)
  • PLS has the ability to handle multicollinearity among IVs and small samples

The calculation of reliability and validity using PLS method use can be further viewed in these articles published. The influence of a moderator on the relationship also been measured in these articles:


That's all for now. 
I will update on how to measure PLS model in the next post. 


Wassalam.


Love
Dr SAA


Thursday, February 22, 2018

Does Fear of New Car Technologies Influence Brand Loyalty Relationship?

Assalamu'alaikum (^_^)

Hi guys. Today, I would love to share with you an article on brand loyalty. This is the first article that I've published when I'm pursuing my study in University Malaysia Perlis (UniMAP). However, as you noticed, I'm still lacking in the writing skills. Yup. I believed this is part of the learning process. Since this is my first paper produced, I'm aware that there's still room for improvement. This research combined two different fields of study; customer relationship management and customer psychology.

Abstract:
The increasing importance of technology in our daily lives has led companies to implement the latest technology on their products before marketing them to their customers. In this era of technology, fuel-efficient vehicles have attracted a great deal attention with a rapidly increasing customer base in the automotive industry. Automobile companies use this as a means of increasing customers’ level of loyalty, due to the anxiety about the system installed in their cars. The purpose of this study is to investigate the indirect effects of brand service quality and brand value towards brand loyalty moderated by technology anxiety. Since moderator variables are rarely tested in the context of PLS model, this investigation will analyze the data by utilizing Partial Least Square (PLS) in measuring the moderating effect of technology anxiety in brand loyalty relationships. The results illustrate that technology anxiety, one of the factors of Car Technology Acceptance Model (CTAM), moderates the relationship between brand service quality, brand value, and brand loyalty.

Introduction:
Nowadays, technology is part of daily life. People look forward to products that offer advanced technological systems which can improve their way of doing things (i.e. during driving). The rapid growth of technology systems adopted in the automotive industry has forced automakers to embed high technology systems into their manufactured cars in order to gain competitive advantages which could increase anxiety level among the automotive consumers (i.e. driver). In the context of this investigation, customers’ feeling (i.e. anxiety) toward the technology installed in their car shall be an important point to understand the intention of the customers to repeat their purchase when purchasing a car. However, Osswald et al. (2012) noted that there is high anxiety level in the public towards technologically advanced cars, which is considered as poor customer behaviour.

Besides, as the population in industrialized countries like North America, Europe, and Japan grows slowly, customer loss can be disastrous to companies. This is due to a smaller number of available new customers to replace those who leave (Blackwell et al., 2012). In the context of this study, a slow growing population in a developing country like Malaysia, has caused automotive companies difficulties in gaining new customers (MIDA, 2012). Therefore, retaining their existing customers is the best way to increase their market share and profitability. In line with the above, Malaysia, a previously overlooked country due to its financial turmoil and political instability, started to gain more and more international attention. The previous Prime Minister Tun Dr Mahathir Mohamed pledged to gradually eliminate tariffs on finished vehicles as part of an agreement signed by Japan and Malaysia in order to gain economic benefits from the trade liberalization between the two countries (Ministry of Foreign Affairs [MOFA] of Japan, 2003).

Tight competition in the business environment has urged companies to take action in building close relationships with their customers and encourage a long-term relationship. Due to this phenomenon, establishing and maintaining brand loyalty is not be easily achieved by companies as the services offered to customers were unsatisfactory and the delivery slow, despite the product quality (Es, 2012). In addition, companies are being forced to embedded excellent value into their products and service as individuals today are able to switch brand easily due to the variety brands present in the market (Koller et al., 2011). Thus, companies need to understand the determinants of brand loyalty among existing and potential customers.

This topic is expected to become a priority in brand building, especially in fast-growing and emerging markets (Meyer, 2014). It is well accepted by scholars and practitioners in the marketing field that it is at least five times more cost efficient to retain the existing customers compared to attracting new customers (Oladele & Akeke, 2012). Brand loyalty is however, a much used and abused term. Although it is widely utilised, many scholars investigate different antecedents of brand loyalty, resulting in a lack of consistency in findings of the investigation (e.g. Thompson et al., 2010; Es, 2012; Sugiati et al., 2013; Kassim et al., 2014). The frequent assumption is that a satisfied customer is the reason for customer to repeat a purchase from the same supplier (Alex & Thomas, 2011; Chinomona & Sandada, 2013; Goel, 2014). However, many other factors could influence customers to repeat the purchase. Therefore, this investigation aims to bridge the research gap by exploring and examining key factors that influence brand loyalty, as well as the effect of technology anxiety on the relationship between brand service quality and brand value towards brand loyalty.

Literature Review:
Since 1950s, marketing researchers have conducted several research in the context of branding (Bastos & Levy, 2012) due to the importance of increasing sales (Li & Green, 2011). Historically, brand loyalty was explained only in terms of customer behavior (i.e. repeat purchase) and since 1969, Day launched a two dimensional concept which includes attitudinal and behavioural (Sivarajah & Sritharan, 2014). However, due to insufficient findings regarding the two dimensions of customer loyalty, researchers in the marketing field added another dimension known as composite (Kaur & Soch, 2013; Tabaku & Kushi, 2013). Therefore, the three dimensions (i.e. attitudinal, behavioral and composite) are necessary to understand and measure the level of brand loyalty (Chuah et al., 2014).

In an increasingly innovative and aggressive business environment, fierce competition exists between firms. One of the key factors of the success of firms is how the customers perceive the quality of service that is offered to them (Auka et al., 2013), as it determines their level of satisfaction (Ivanauskienė & Volungėnaitė, 2014). Therefore, it is important for firms to focus not only on improving the quality of their products to create an intention to purchase, but also to improve the quality of their services. In the past, little effort has been spent in maintaining a relationship with customers after they purchased goods in the retail business even though the brand service quality was found to encourage customers to do repeat purchase and remain loyal to the brand (Auka et al., 2013). Brand service quality is defined as the positive attitudes of customers towards a brand (Chinomona et al., 2013). Offering high quality service is not the only way to increase the level of brand loyalty among customers, as anxiety towards technological tools installed in cars also plays a vital role in influencing buyers’ brand loyalty.

In the business world of today, every company tries to grab the attention of their potential customers by embedding high value into their products. Brand value is an important element in gaining the competitive advantage (Sugiati et al., 2013). It could be defined as what customers think of the brand, including the gap between the price that the customers are willing to pay and the benefit gained from the products offered by the firms (Thaichon et al., 2013). Customers who view a product or service as having more value than their expectations will encourage them to do repeat purchase with the same company (Alex & Thomas, 2011; Goel, 2014) and it can be measured by examining whether this brand is offering a reasonable and fair price as well as giving a good value for the money spent in purchasing the product instead of the competitors (Auka et al., 2013). Focusing on brand value helps firms to maintain a longer relationship with customers as it builds trust towards the products’ brand (Hanzaee & Andervazh, 2012) that will finally lead to brand loyalty (Geçti & Zengin, 2013).

This study aims to add to this scant body of knowledge by including the variable technology anxiety when testing the level of brand loyalty among automotive consumers. Similar to other industries, the use of electronic components in the automotive industry has rapidly increased as multiple aspects of driving a modern automobile is controlled by advanced technological electronics such as acceleration, braking, security, and navigation (Osswald et al., 2012). Additionally, with the latest technology, auto manufacturers currently produce numerous fuel-efficient cars believed to be able to protect the environment, in response to reports that transportation is responsible for about 20 percent of the global greenhouse gas emissions released into the air (Benthem & Reynaert, 2015). Furthermore, technology can be used as one of the preventive tools in providing greater safety and avoiding theft (Laguador et al., 2013). Therefore, consumers prefer to purchase a safer car which includes additional safety features such as airbags, antilock brake systems, and anti-theft alarm systems.

More recently, researchers demonstrated the benefits of technology in the automotive industry, especially in providing safety in terms of information, safety environment and driving tasks assistance (Osswald et al., 2012). The message here is clear: A lower anxiety of technology increases trust towards a brand, while high anxiety reduces trust towards the brand. Once the customers place their trust in a brand, they intend to remain loyal to the brand. In relation to customer behaviour in technology-related industries, it is recognized that the relationship between the infrastructure of technology and customer intention is moderated by technology anxiety (Yang & Forney, 2013). Therefore, technology anxiety is believed to play a role in strengthening brand loyalty relationships.

In previous studies, researchers employed Technology Acceptance Model (TAM) and Car Technology Acceptance Model (CTAM) in order to measure the level of anxiety among users towards technology (e.g. Osswald et al., 2012; Gelbrich & Sattler, 2014). CTAM is an extension of Unified Theory of Acceptance and Use of Technology (UTAUT). The theory of UTAUT was primarily developed to explain and predict users’ acceptance towards technology from the context of the organization. Since the UTAUT model has only been used to measure anxiety in context of computers (Yang & Forney, 2013) and not from the context of other technological system such as technology usage in car (Osswald et al., 2012), CTAM has been introduced by Venkatesh et al. (2012) to further improve the explanatory power of the  model. Hence, to predict technology anxiety in the context of customers regarding the technology system installed in the cars, this investigation intends to revisit the predicting factors postulated by CTAM by introducing brand service quality and brand value to measure and analyze the technology anxiety among drivers.

Conceptual Framework and Hypothesis Development:
In line with the literature review and the purpose of this investigation, a proposed framework was constructed to investigate the indirect effect of brand service quality and brand value towards brand loyalty, with the moderating role of technology anxiety. The proposed model is depicted in... [cont.]

To read more, you can view it HERE


# Success has nothing to do with what you gain in life or accomplish for yourself. It's what you do for others. -Danny Thomas


Love,
Dr SAA